Photon Server Stack Overflow
Stack Overflow is a background exception that may cause silent craches. It is tricky to debug it.
This document explains how to deal with stack overflow exceptions occurring due to custom code running on Photon Server.
Production Environment
This is the procedure we recommend to follow in order to gather dumps and a stack trace from it in case of a stack overflow.
Prerequisites
Download and install Debug Diagnostic Tool. Download v2 Update 2 or v2 Update 3.
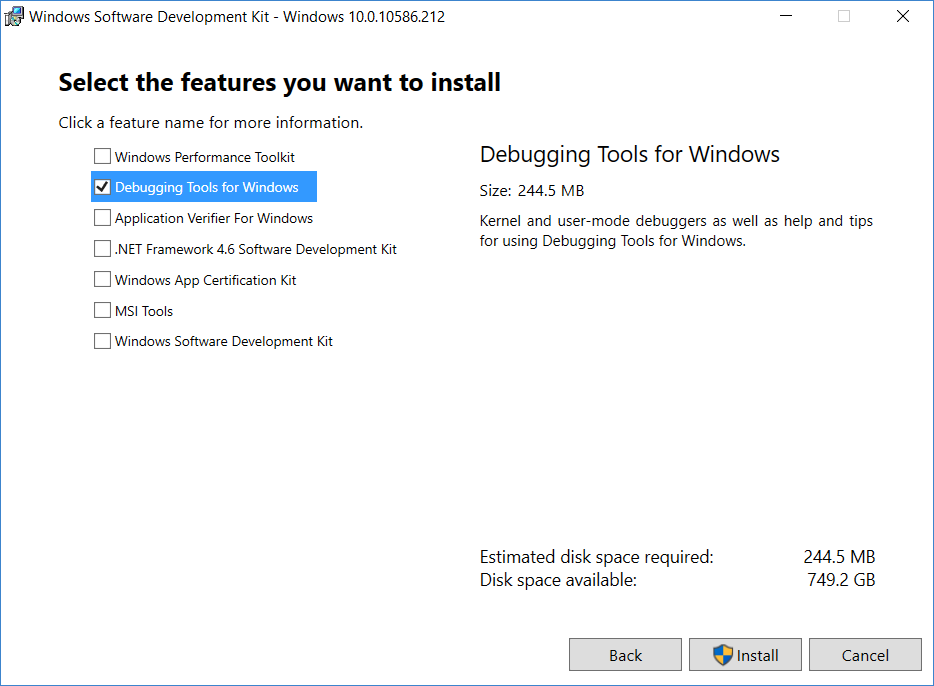
Download and install WinDBG. Windows Debugger is part of Windows Development Kit.
Please download the appropriate dev. SDK for your Windows version and choose "Debugging Tools For Windows" as a feature to be installed during installation wizard.
Setup Debug Diagnostic Tool: Dump Collection
We are going to follow a step-by-step guide:
Open Debug Diagnostic Tool ("DebugDiag 2 Collection"). By default a "Select Rule Type" wizard window should be open. Otherwise, please click "Add Rule". Select "Crash" as "Rule Type" and hit "Next".
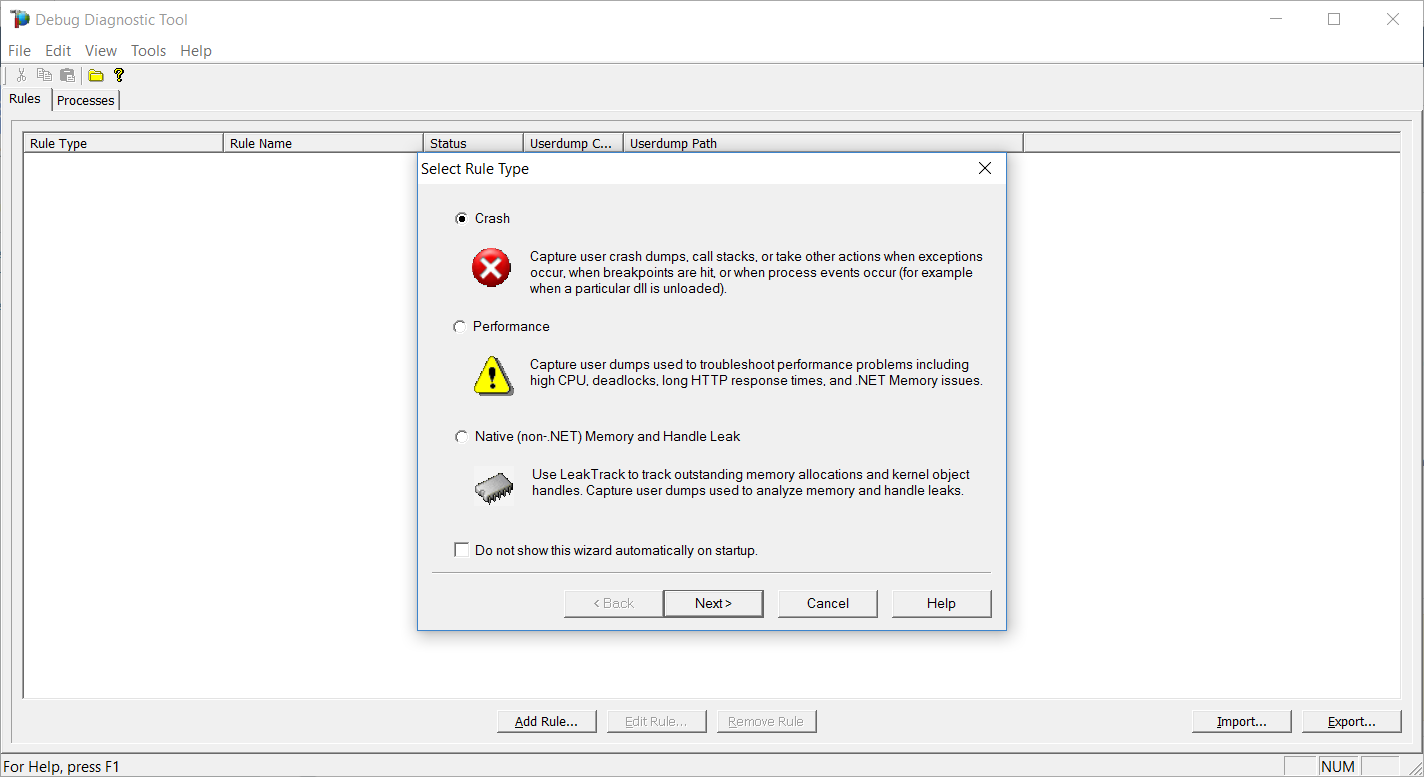
Select Rule Type In "Select Target Type" window, select "A specific process" and hit "Next".
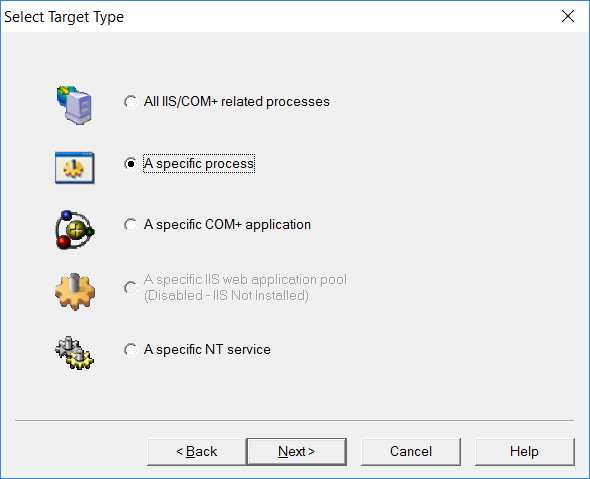
Select Target Type In the "Select Target" window, choose "PhotonSocketServer.exe" from the list and hit "Next".
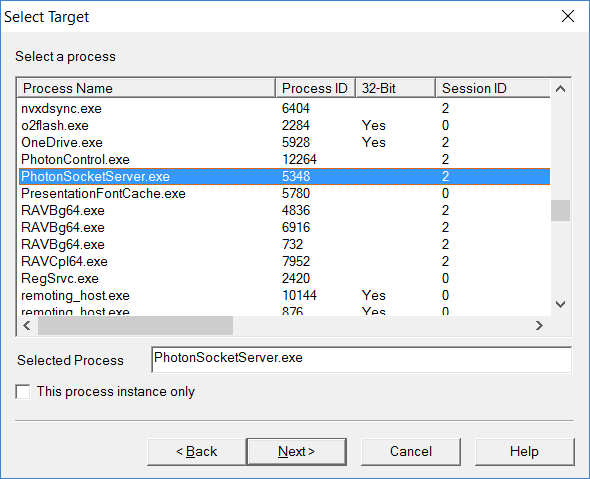
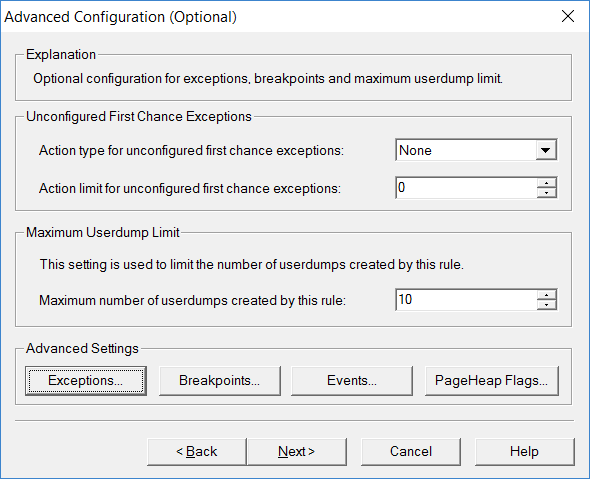
Select Target Process In the "Advanced Configuration" window, "Advanced Settings" section click on "Exceptions".

Advanced Configuration In the "First Chance Exception Configuration" window, click "Add Exception...".
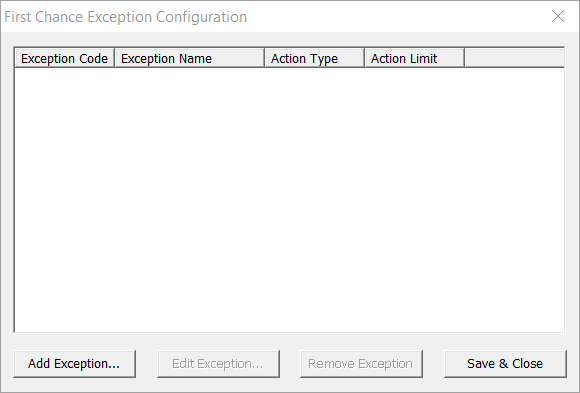
First Chance Exception Configuration In the "Configure Exception" window, choose "Stack Overflow" from the list of exceptions.
Then on the right, from the dropdown menu choose "Full Userdump" as "Action Type" and set "Action Limit" to 0.
Once done, click "OK".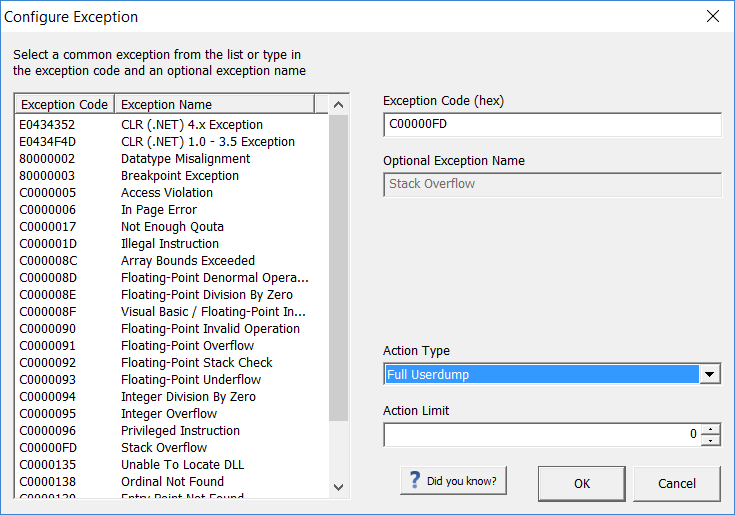
Configure Exception A warning dialog will be shown to you about the Action Limit value 0. Continue by clicking "Yes".
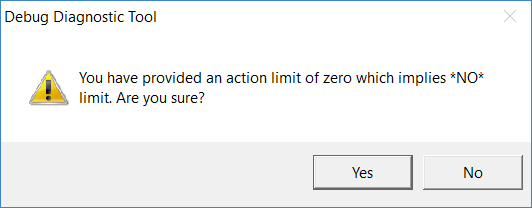
Action Limit 0 Warning Now you are able to see the configure Stack Overflow exception added in the "First Chance Exception Configuration" window. Hit "Save & Close".
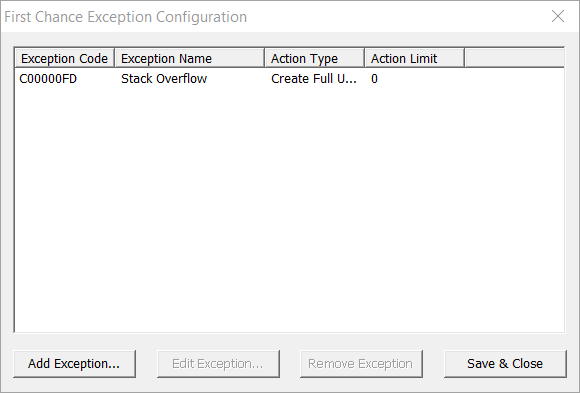
First Chance Exception Configuration Back to the "Advanced Configuration" window, just hit "Next".
Advanced Configuration In the "Select Dump Location And Rule Name" window, you can change the default rule name. Set the "Userdump Location" to a temporary folder path of your choice and click "Next".
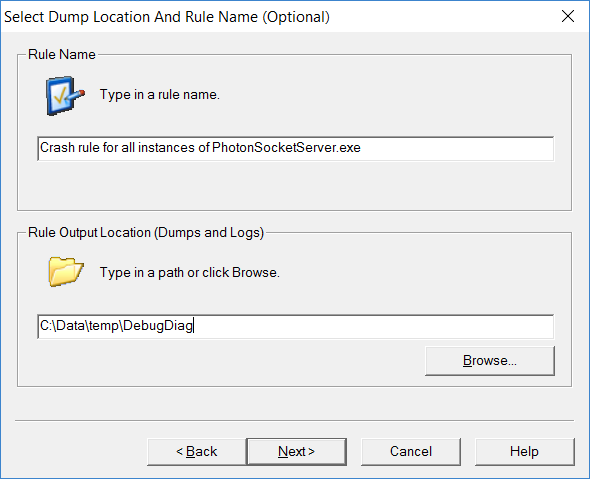
Select Dump Location And Rule Name The "Add Rule" wizard reaches its final window "Rule Completed". Choose "Activate the rule now" and hit "Finish".
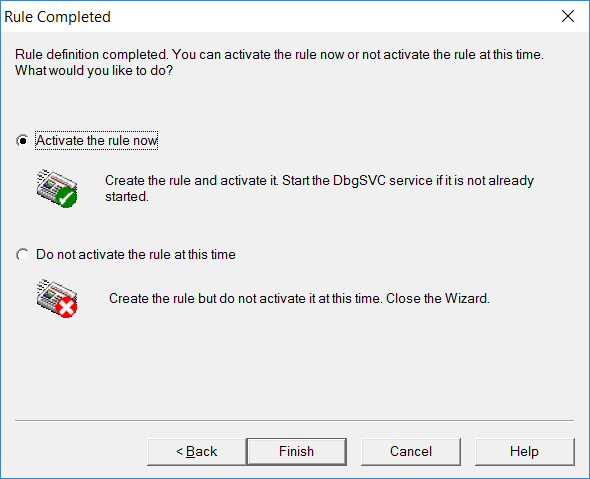
Rule Completed The Debug Diagnostic should prompt you to automatically set the "Symbol Search Path" to
srv*c:\symcache*https://msdl.microsoft.com/download/symbols.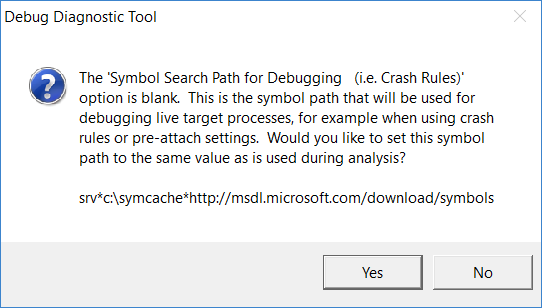
Symbol Search Path for Debugging In case it doesn't, please manually set this in "Tools" -> "Options & Settings" to get a better stacktrace.
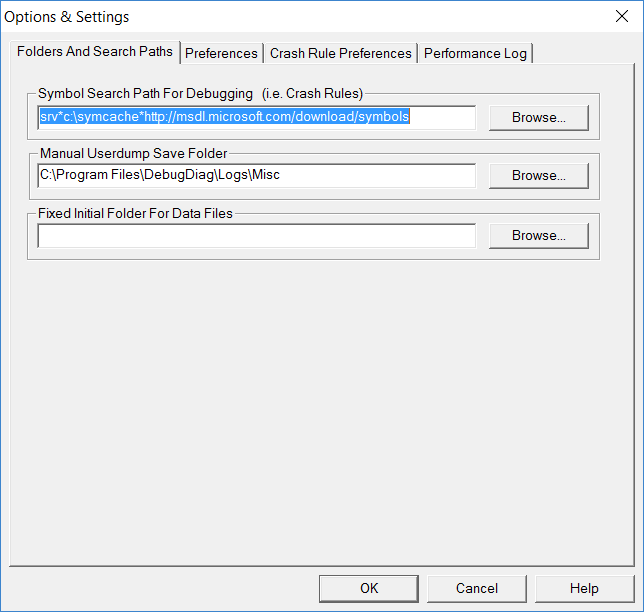
Set Debugging Symbols Back to the main Debug Diagnostic Tool window, you can see the configured rule.
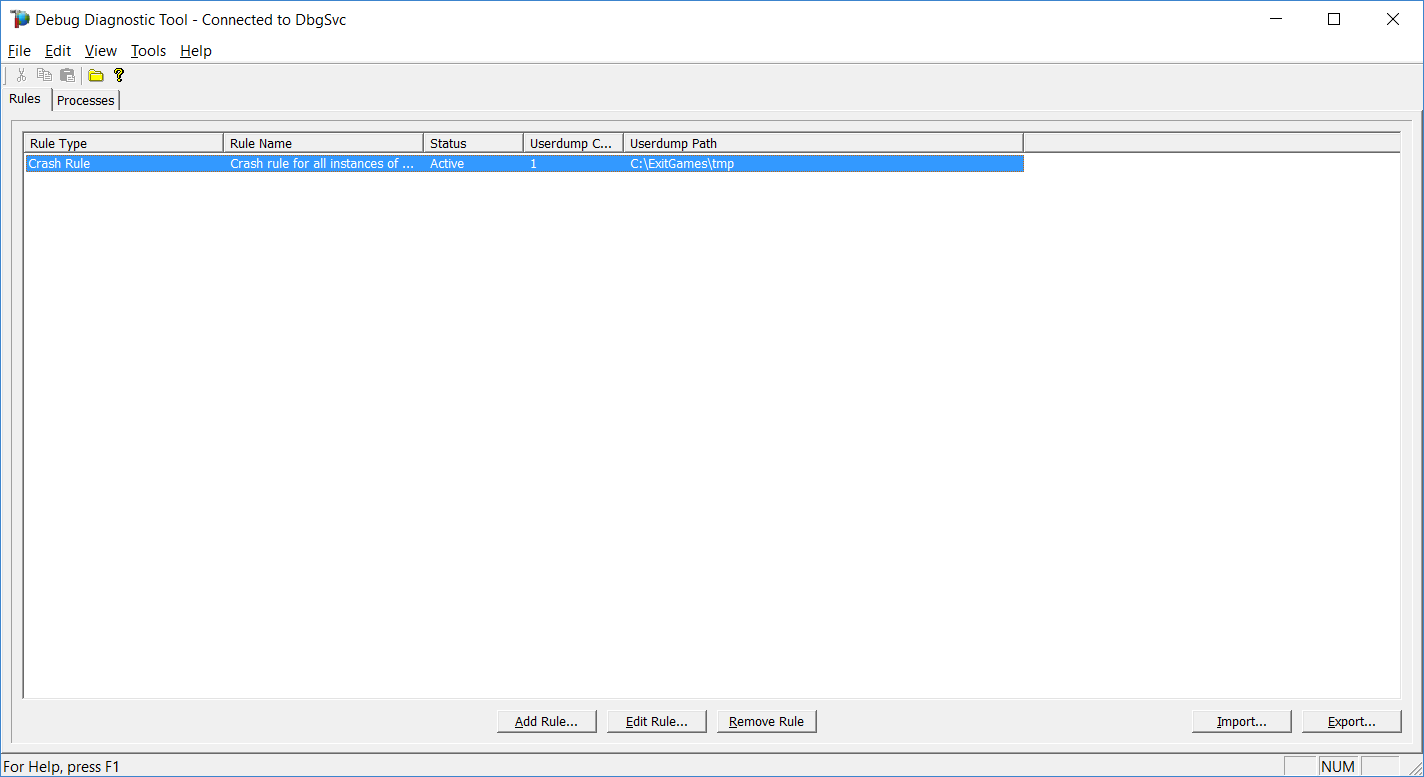
Crash Rule After Configuration
Setup Debug Diagnostic Tool: Dump Analysis
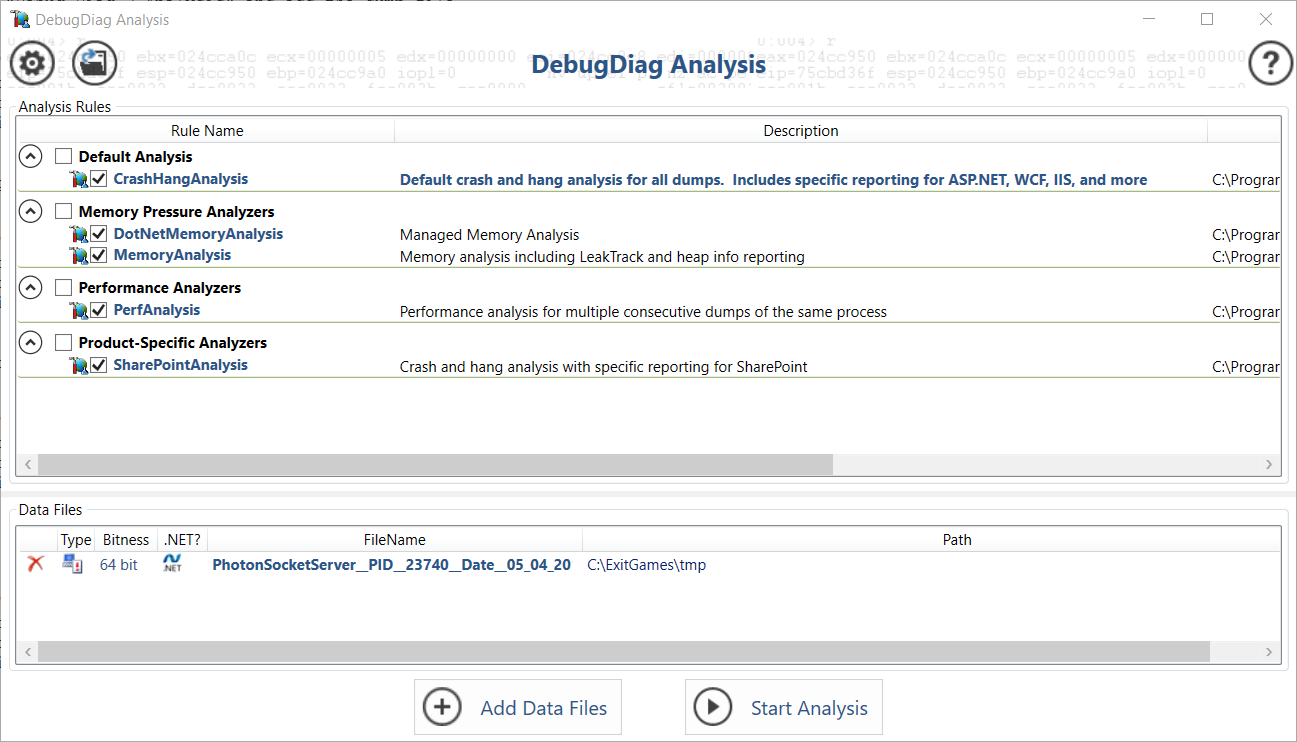
Now let's open Debug Diagnostic Tool ("Debug Diag 2 Analysis").
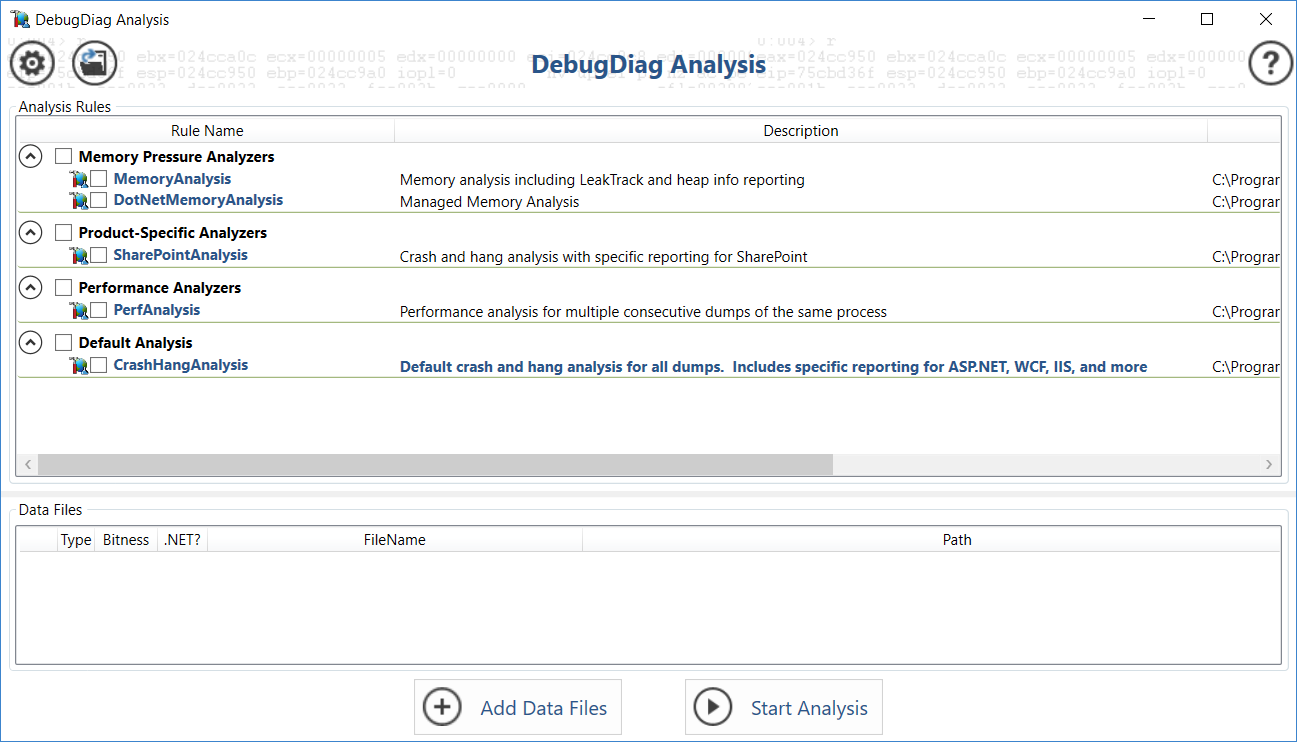
Debug Diag 2 Analysis Let's add the dump file using "Add Data Files".
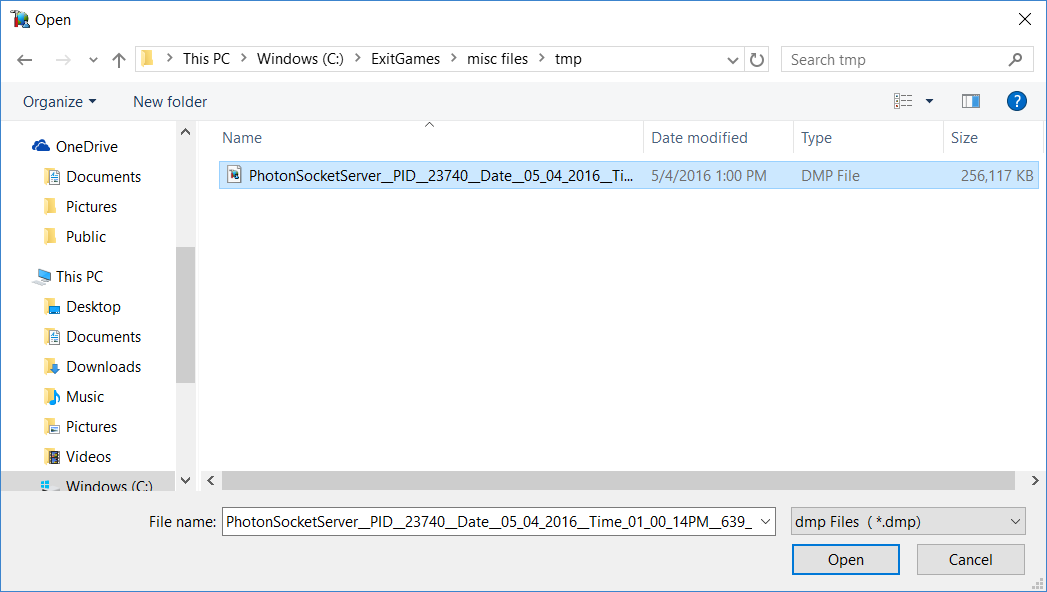
Adding collected dump file Once we have added the dump file, we can "Start Analysis".
Starting analysis of dump file You should see the analysis loading which could take some time, then a report will be open in the browser.
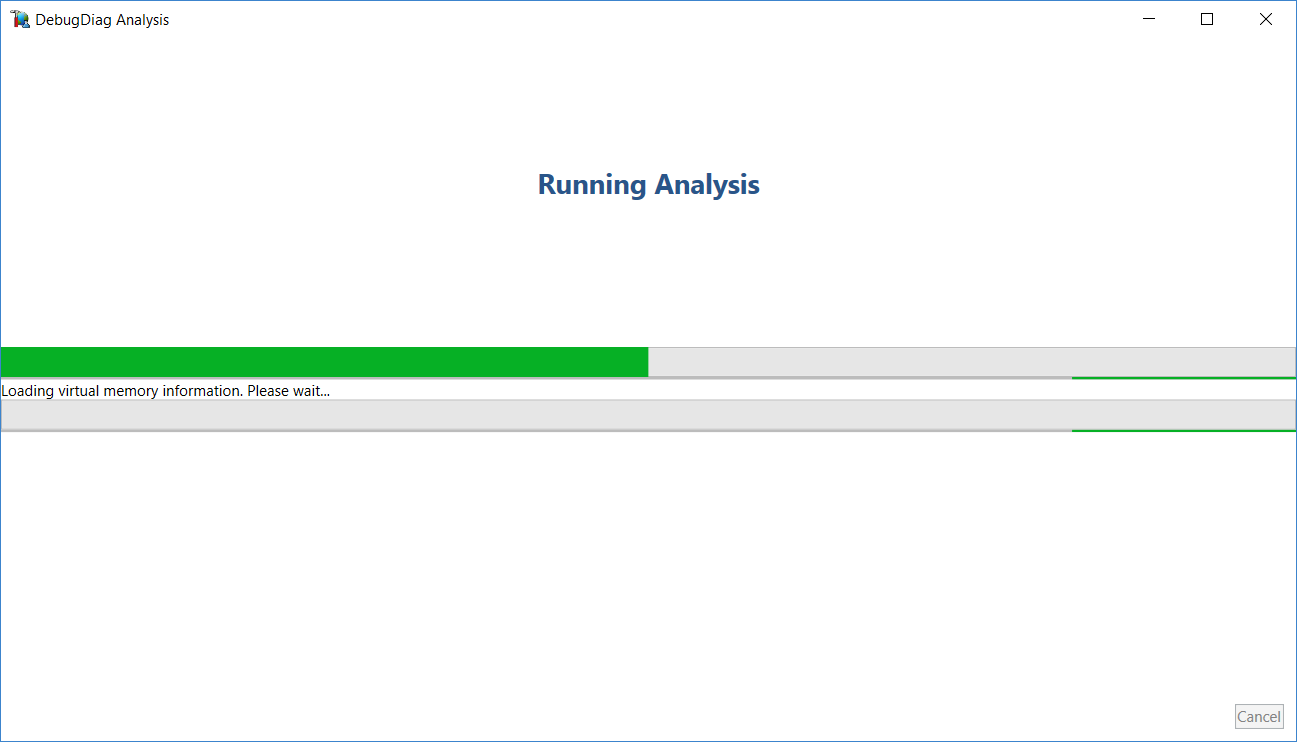
Loading Debug Diagnostic Analysis
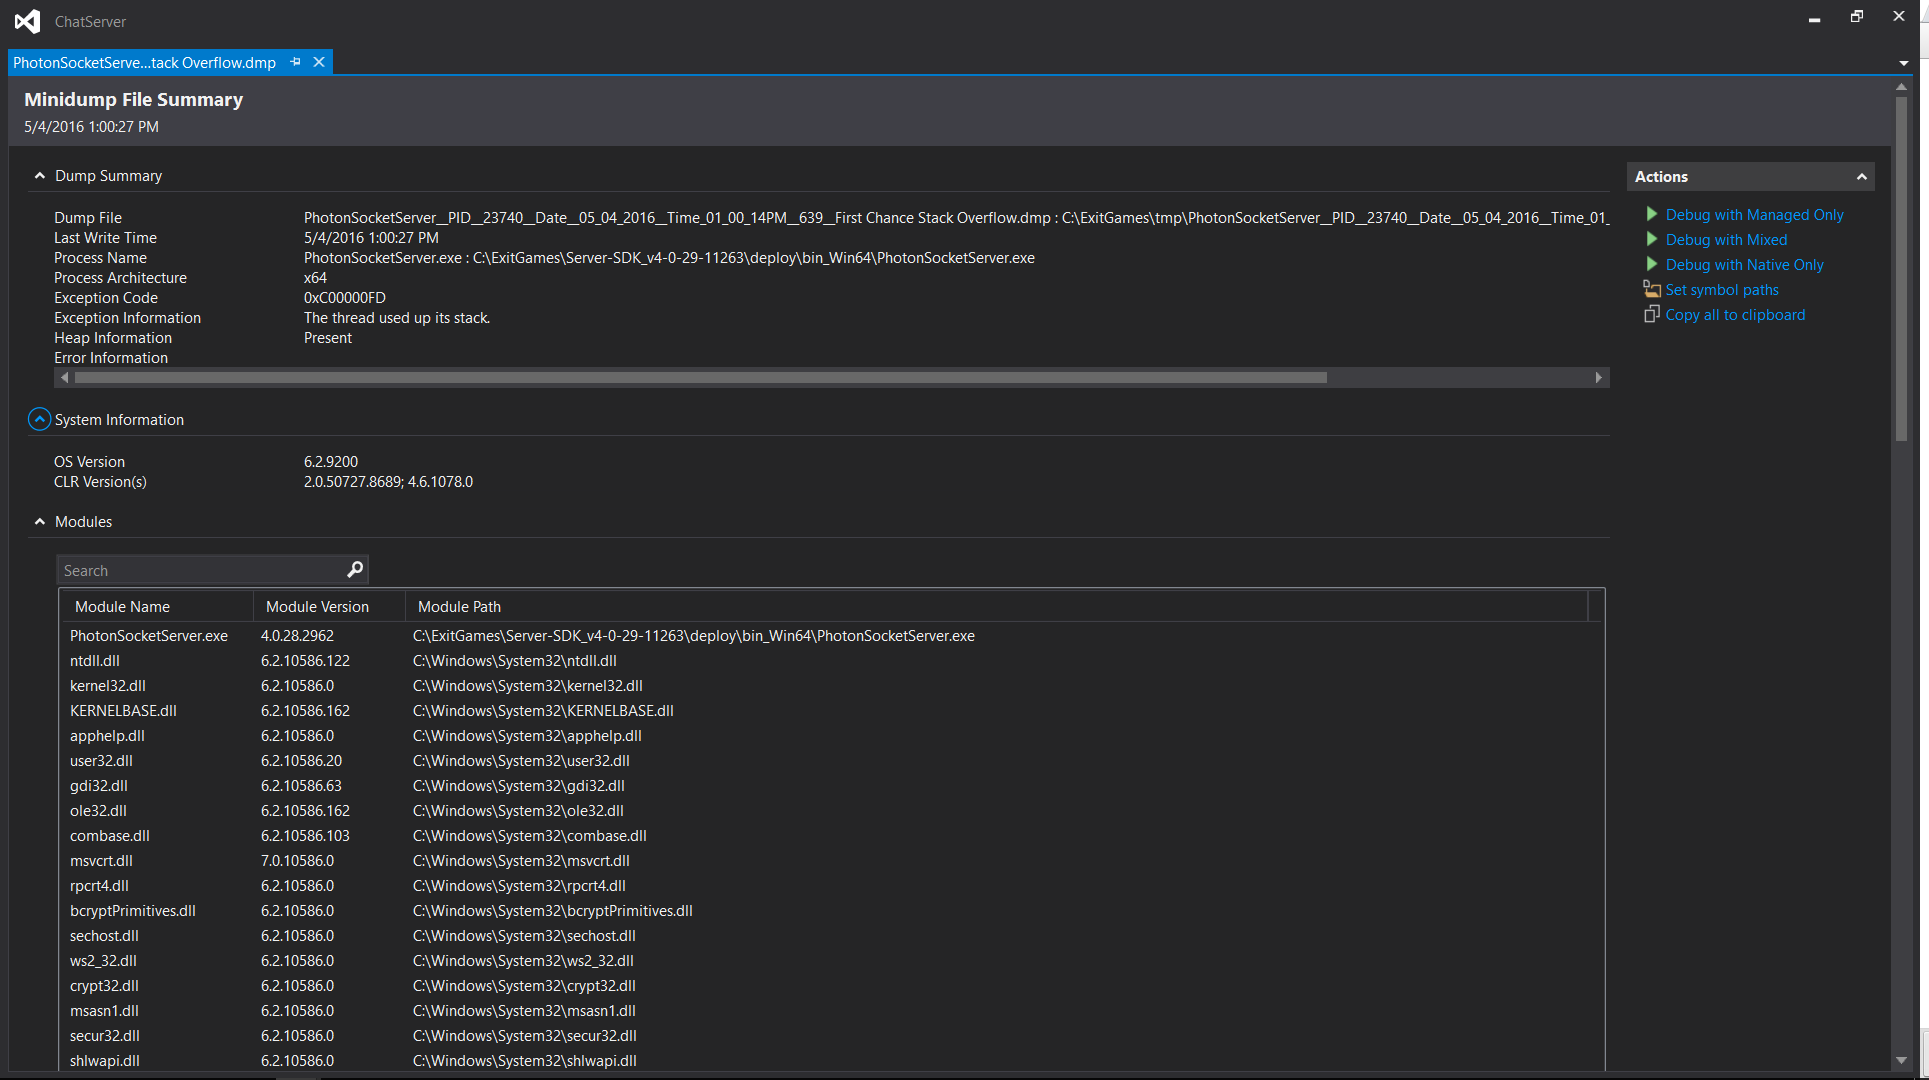
Open the Dump using Visual Studio
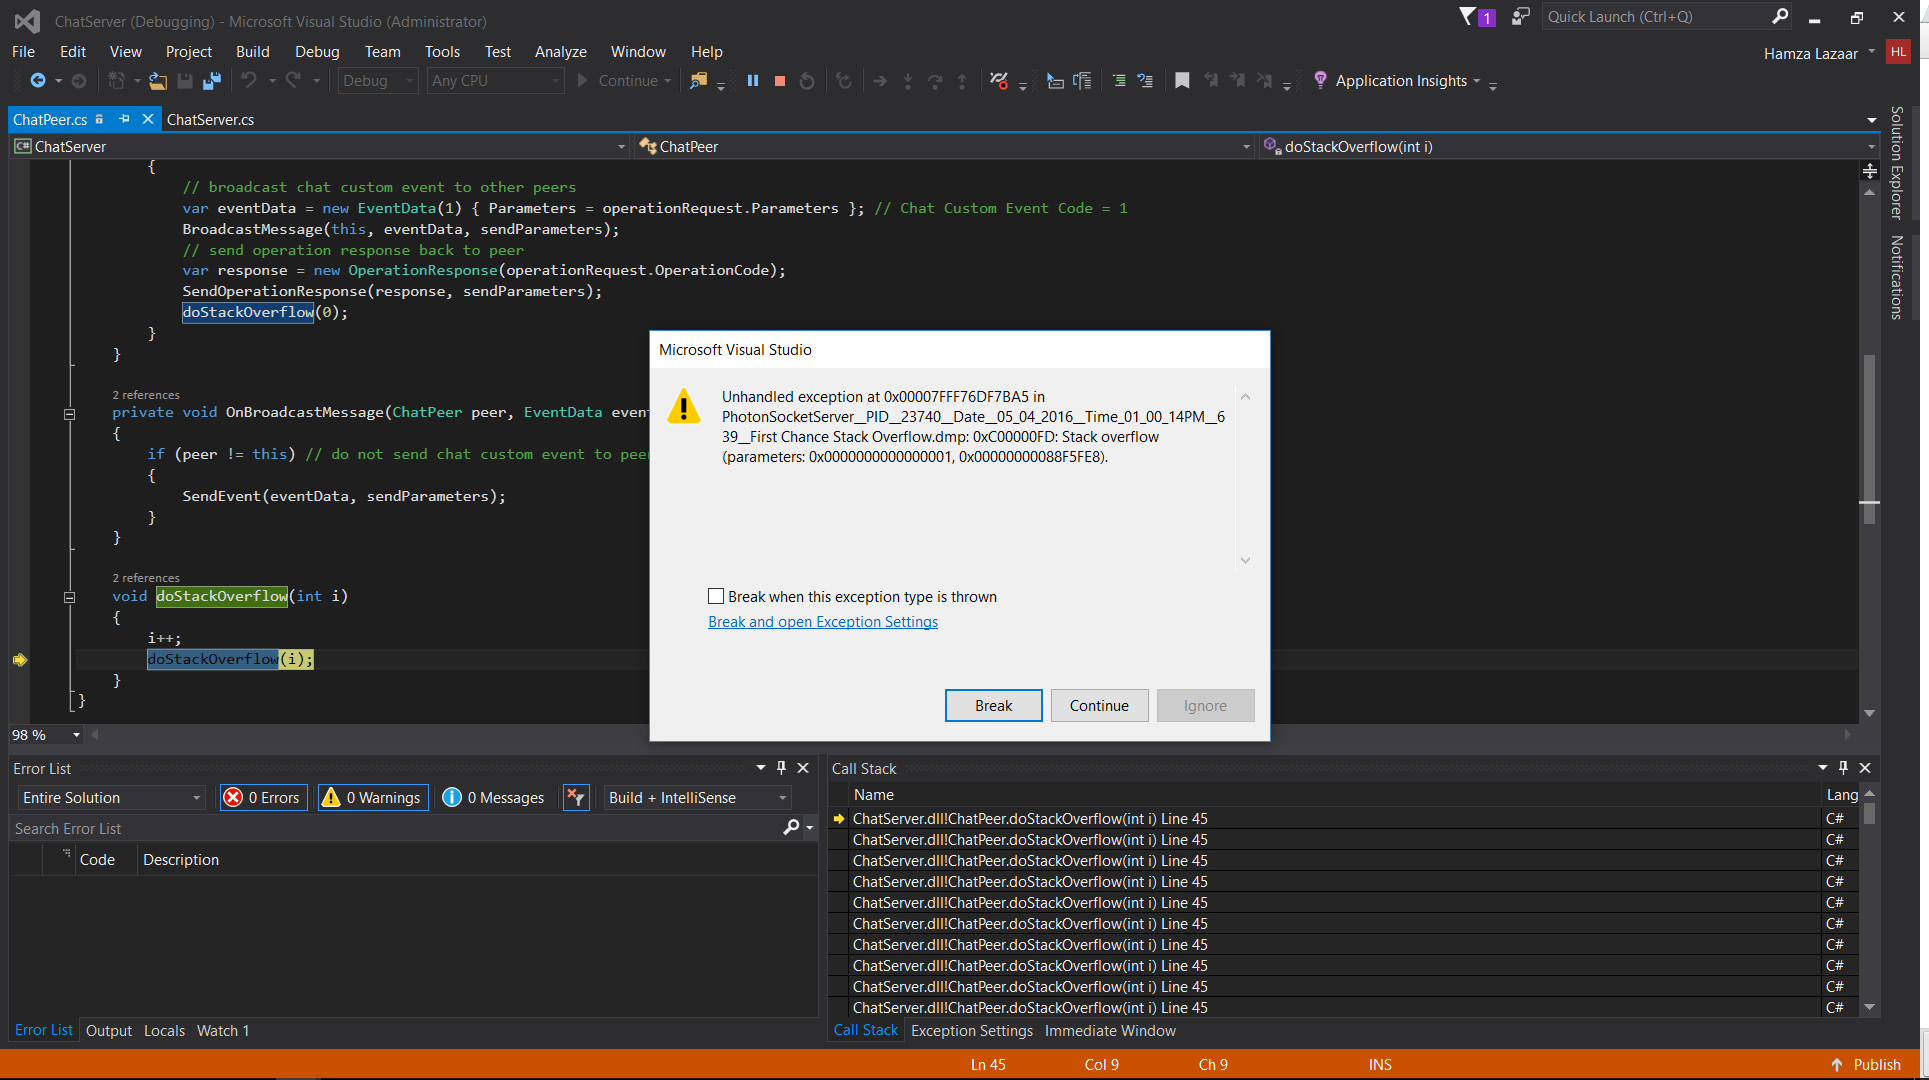
Open the dump file in Visual Studio and run "Debug Mixed Mode".
The debugging will break when the stack overflow exception occurs. You will get the exception breakpoint and a full stack trace.
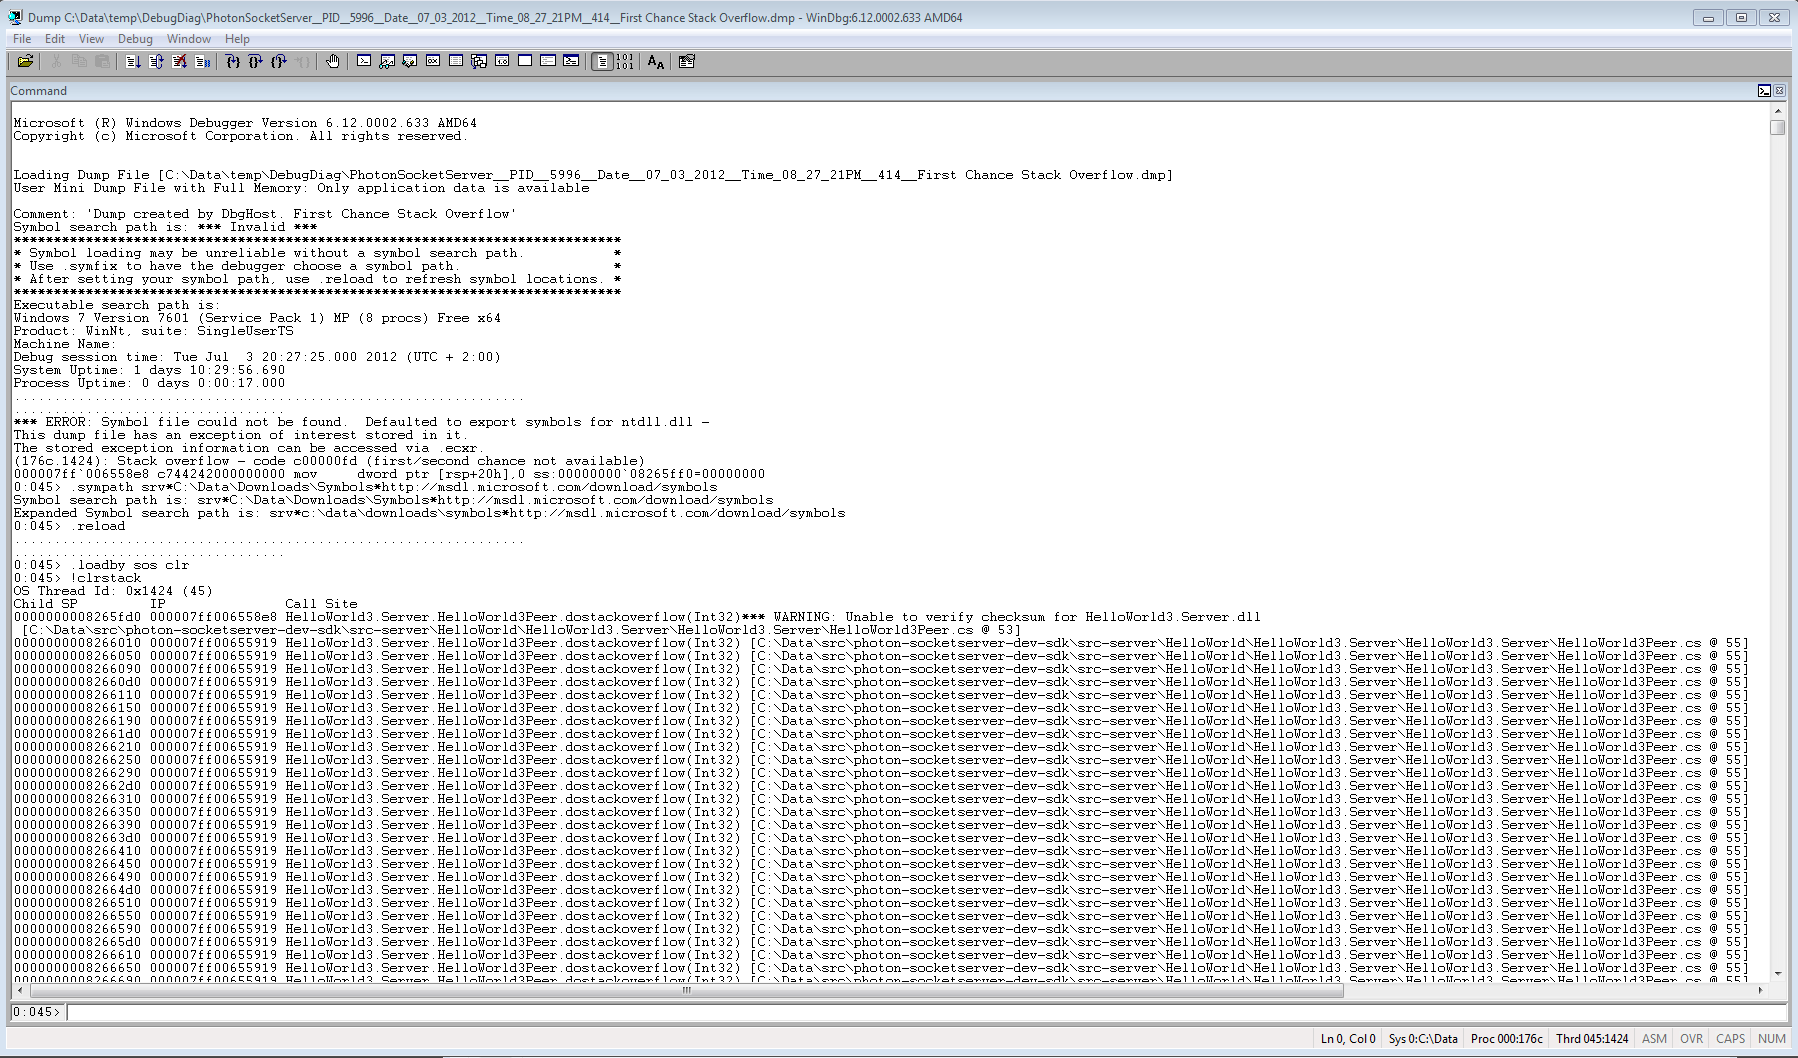
Open the dump using WinDBG and set the following commands:
.sympath srv*C:\symcache*https://msdl.microsoft.com/download/symbols.reload.loadby sos clr. (Note:.loadby sos clris if you are debugging .NET 4.0 or above, otherwise the command is.loadby sos mscorwks.)!clrstack
Development Environment
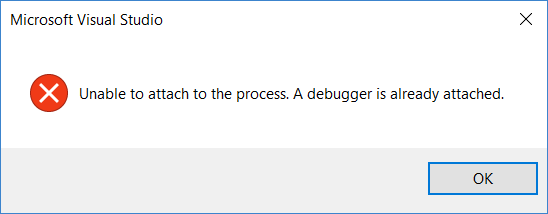
You can notice that once the rule is added you can't attach Visual Studio debugger to "PhotonSocketServer" process.
This is because the Debug Diagnostic Tool auto attaches as debugger to the process configured in the rule.
If you happen to start Photon Server from Visual Studio when Debug Diagnostic Tool is running with an active rule for Photon Server,
the latter will crash on startup without leaving any dump.
We recommend to remove the following registry keys to make sure the debugging tools don't get in the way of each other:
HKEYLOCALMACHINE\SOFTWARE\Microsoft\Windows NT\CurrentVersion\AeDebugHKEYLOCALMACHINE\SOFTWARE\Microsoft\Windows\Windows Error Reporting\LocalDumps